Proactive IT monitoring simplified.
ManageEngine OPManager keeps your network, servers and applications running at peak performance. And all that from a single intuitive dashboard.
24/7 >10k 99.9%
Real-time visibility Devices Monitored Uptime supported
Try our live test environment!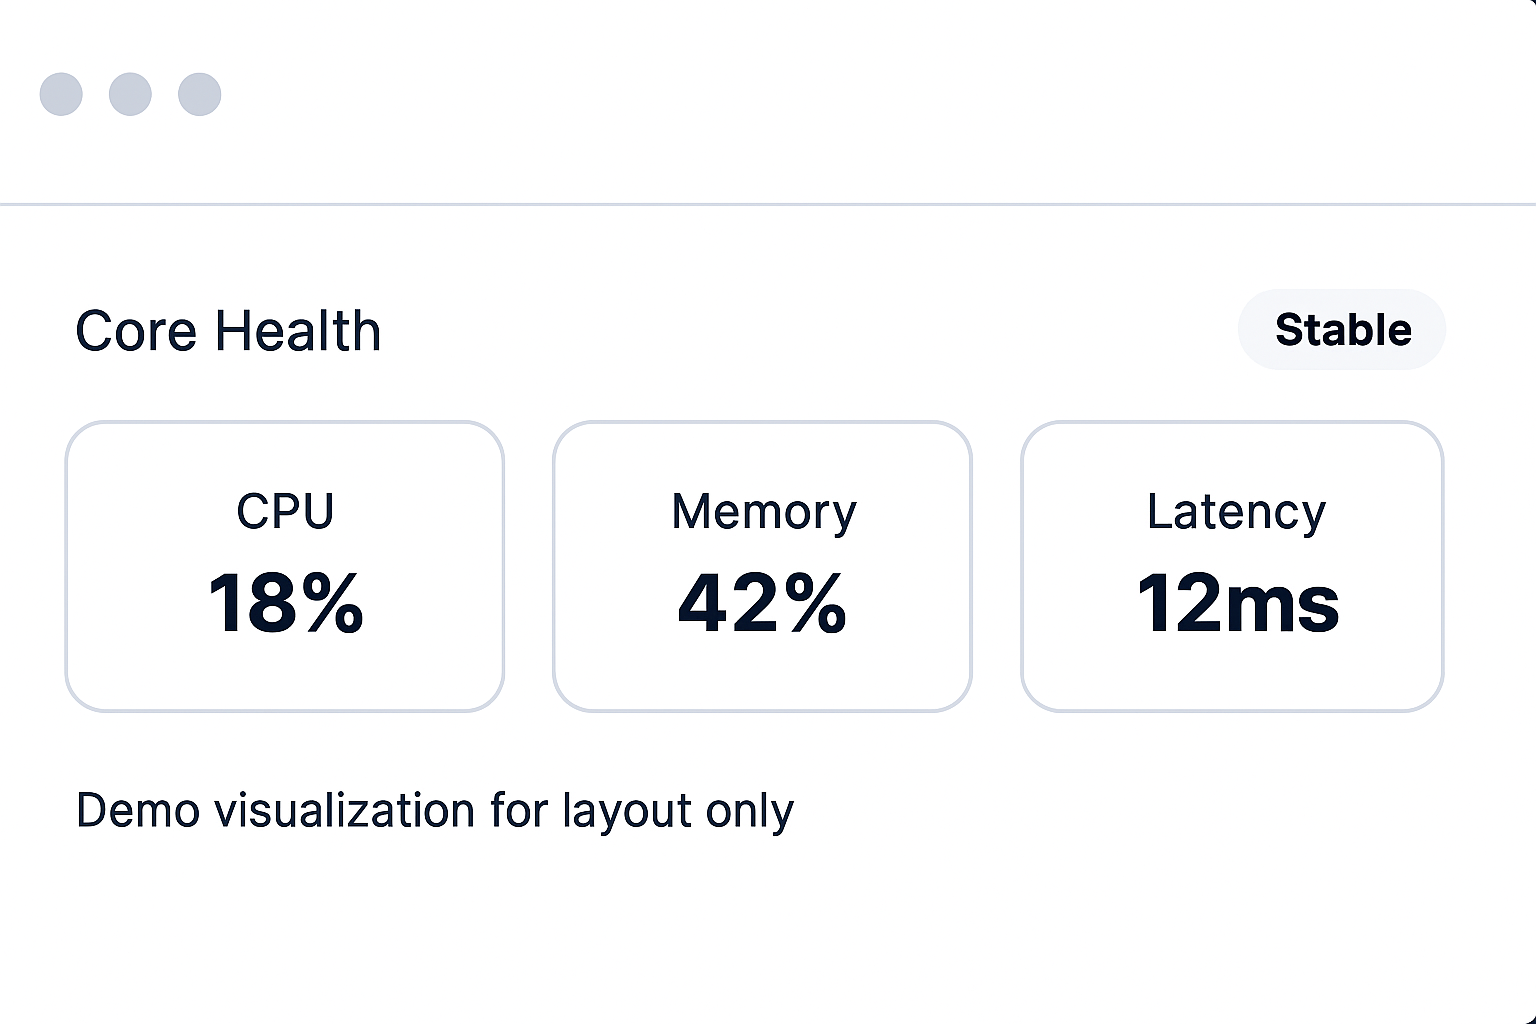
What is OpManager?
ManageEngine OpManager is a powerful, all-in-one network monitoring and IT management solution that helps organizations maintain peak performance and reliability across their entire infrastructure. From switches, routers, and firewalls to servers, virtual machines, and applications, OpManager delivers complete real time visibility and control through a single, intuitive interface. Its intelligent dashboards track critical metrics like bandwidth usage, CPU and memory performance, and device availability, enabling IT teams to act before issues impact productivity.
With its new AI-powered capabilities, OpManager takes network management to the next level — analyzing patterns, predicting potential problems, and even suggesting optimal solutions. This allows IT teams to automate routine tasks, make faster decisions, and resolve incidents with minimal effort. Combined with proactive alerts, automated workflows, and detailed reporting, OpManager empowers businesses to simplify complex operations, optimize resources, and ensure uninterrupted business continuity.

Real-time network monitoring
Track devices, bandwidth and availability instantly

Server & application monitoring
Detect issues before they affect users

Custom dashboards & reports
Gain actionable insights at a glance

Automated alerts & workflows
Resolve problems faster with smart automation
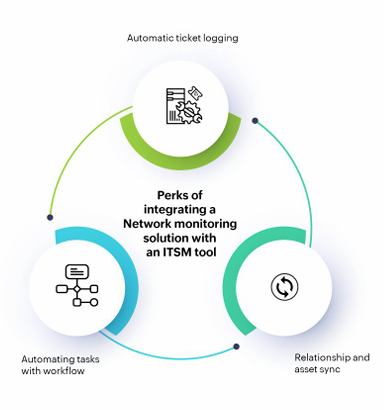
ITSM Integration with OpManager
OpManager seamlessly integrates with leading IT Service Management (ITSM) tools like ServiceNow, ManageEngine ServiceDesk Plus, and others to bridge the gap between IT operations and service delivery. With this integration, network faults or performance issues detected in OpManager can be automatically logged as service tickets, prioritized, and assigned to the right teams. This ensures f aster incident response, streamlined workflows, and better collaboration between monitoring and support teams—ultimately improving uptime and delivering a smoother IT service experience for end-users.
With rule-based automated ticket creation, critical alert escalation, and two-way updates, OpManager ensures that network issues trigger the appropriate actions in your ITSM tools and their resolutions are reflected back in real time. For example, when a server crosses a performance threshold, an incident is generated in your service desk and once resolved, the alert is automatically cleared in OpManager. This tight integration delivers proactive network management and reduces manual effort across your IT operations
Why Choose OpManager?


Scalable
Probe-Central architecture is designed to scale the needs of large enterprises

Customizable
Create your own network dashboard with over 200 performance widgets

Differences between OpManager Professional and Enterprise
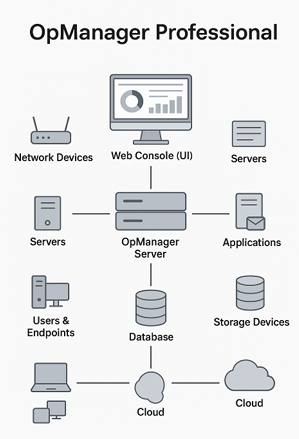
OpManager Professional
OpManager Professional is designed for small to mid-sized businesses that need powerful yet easy-to-manage network monitoring. It offers real-time visibility into your network devices, servers, and applications, ensuring your IT infrastructure runs smoothly. With features like performance monitoring, fault management, customizable dashboards, and instant alerts, the Professional edition helps IT teams detect issues early, reduce downtime, and maintain high service availability —all from a single, intuitive console.
The OpManager Professional architecture image illustrates how the product centrally monitors all IT infrastructure components from a single server. At the core lies the OpManager Server, which connects to a Database that stores performance metrics, alerts, and historical data, and a Web Console (UI) through which IT teams access dashboards, reports, and alerts. Surrounding this core are the monitored infrastructure elements: network devices such as routers and switches, servers (both physical and virtual), applications like databases and web servers, users and endpoints including laptops and desktops, storage devices such as SAN/NAS, and cloud resources like AWS or Azure. These devices continuously send performance and availability data to the OpManager Server via SNMP, WMI, or APIs, where it is processed, visualized, and analyzed. This architecture highlights how OpManager Professional delivers real-time monitoring, alerting, and reporting from a single site, making it ideal for small to medium organizations that require centralized network and server management without the complexity of distributed probes.
OpManager Enterprise
OpManager Enterprise is built for large organizations with distributed networks and complex IT ecosystems. It goes beyond standard monitoring by offering scalability, advanced automation, multi-site support, and AI-powered insights. With its distributed architecture, Enterprise enables centralized monitoring of thousands of devices across multiple locations while ensuring high performance and reliability. It also provides advanced reporting, workflow automation, and predictive intelligence to help enterprises proactively manage their IT operations and align IT with business goals.
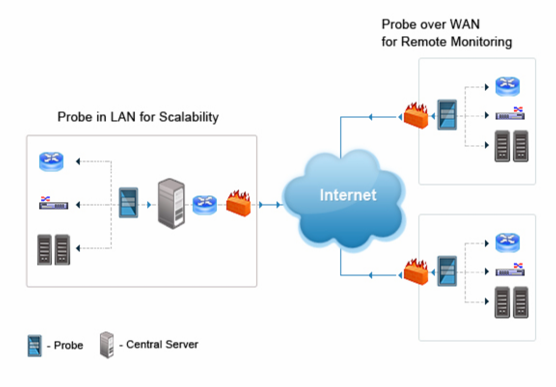
OpManager Enterprise is built for organizations with large or distributed IT environments. Instead of relying only on a central server, it uses probes to extend monitoring across multiple sites. • At your main data center, the central server acts as the command hub. It processes all monitoring data, generates reports, and gives your IT team a single dashboard to manage the entire network. • Within the same location, a LAN probe helps balance the workload by collecting data from nearby servers, switches, and routers. This ensures scalability when thousands of devices need monitoring. • For branch offices or remote sites, WAN probes are deployed locally. They monitor devices at that location and securely send the data back to the central server over the internet. Even if the WAN link is temporarily down, the probe keeps collecting data and syncs it once connectivity is restored. With this design, OpManager Enterprise ensures real-time visibility across all offices, data centers, and branch networks — all from one unified platform. It’s scalable, reliable, and built for enterprises that can’t afford blind spots in their IT infrastructure.
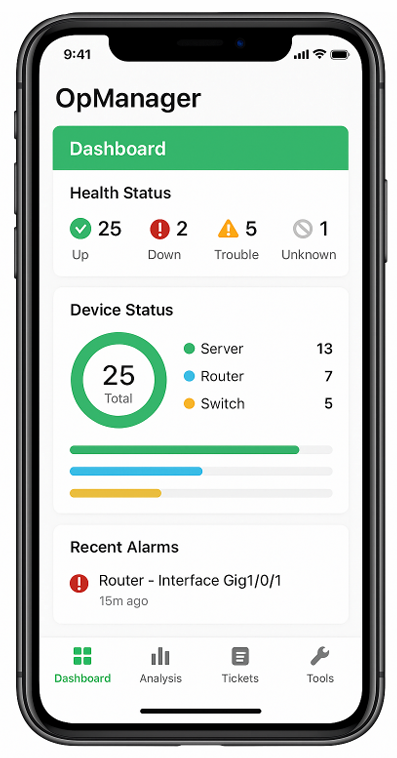
Network monitoring on the go
OpManager mobile app lets IT administrators monitor and manage their network infrastructure directly from a mobile device. With the app, you can view the real-time health of servers, routers, switches and other critical devices, receive push notifications when alerts are triggered, acknowledge or clear alarms, and drill down into performance metrics such as CPU, memory, disk usage, and interface traffic. It also lets you run basic troubleshooting actions (like ping, traceroute, interface reset), view dashboards, and keep track of ticket status and device availability — all on the go — so you can react quickly to issues without being at your desk
Compare editions
|
OpManager
|
OpManager Professional
|
OpManager Enterprise
|
OpManager Standard
|
|---|---|---|---|
| Max Devices Count | 1000 | 10000 | 1000 |
| Multi-Site/ Distributed Network Monitoring | |||
| Network Discovery | |||
| CSV Discovery | |||
| Single Node Discovery | |||
| Schedule Discovery | |||
| Layer 2 Discovery | |||
| Discovery Rule Engine | |||
| Discovery of Virtual Environment | |||
| Availability Monitoring | |||
| Interface Monitoring | |||
| SNMP Monitoring | |||
| WMI Monitoring | |||
| CLI Monitoring | |||
| VMware Monitoring | |||
| Hyper-V Monitoring | |||
| Xen Monitoring | |||
| UCS Monitoring | |||
| Process Monitoring | |||
| Windows Services Monitoring | |||
| TCP Port Based Service Monitoring | |||
| Script Monitoring | |||
| EventLog Monitoring | |||
| SysLog Monitoring | |||
| URL Monitoring | |||
| File/Folder Monitoring | |||
| Active Directory Monitoring | |||
| Exchange Server Monitoring | |||
| MS SQL Monitoring | |||
| Hardware Monitoring | |||
| VLAN Monitoring | |||
| Local Authentication | |||
| AD Based Authentication | |||
| Radius Authentication | |||
| Pass Through Authentication | |||
| REST API Access | |||
| Custom Dashboards | |||
| User Specific Dashboard | |||
| NOC View | |||
| Embed Widget | |||
| Real Time Widgets | |||
| Business Views | |||
| Virtual Environment Maps | |||
| Integration with Google Maps | |||
| Zoho Maps Integration | |||
| 3D Datacenter View | |||
| Alarm Monitoring | |||
| Alarm Escalation | |||
| SNMP Trap Monitoring | |||
| IT Workflow Automation | |||
| Third Party Integration | |||
| Notification Profile (Email/SMS alerts, etc.) | |||
| Rebranding | |||
| Scheduled Reports | |||
| Raw Data Maintenance | 60 days | 180 Days | 7 Days |
| Troubleshooting Tools [RDP/SSH, etc.] | |||
| Android/ iOS Mobile App | |||
| Multi-Language Support | |||
| Failover | Included | ||
| IP SLA Monitor | |||
| Network Traffic and Bandwidth Analysis | Available [Free for 2 Interfaces] | Available [Free for 2 Interfaces] | Available |
| Network Configuration Management [NCM] (Add on) | Available [Free for 2 Devices] | Available [Free for 2 Devices] | Available |
| IP Address Management [IPAM] (Add on) | Available [Free for 50 Used IPs] | Available [Free for 50 Used IPs] | Available |
| Switch Port Management [SPM] (Add on) | Available [Free for 50 Switch Ports] | Available [Free for 50 Switch Ports] | Available |
| Firewall Monitoring (Add on) | |||
| Storage Monitoring (Add on) | |||
| Applications Manager [APM] (plugin) | Available [Default - 5 Monitors] | Available [Default - 5 Monitors] | Available [Default - 5 Monitors] |